Performance Dashboard
Our intuitive dashboard provides comprehensive analytics of your liquidity positions with AI-powered insights and suggestions.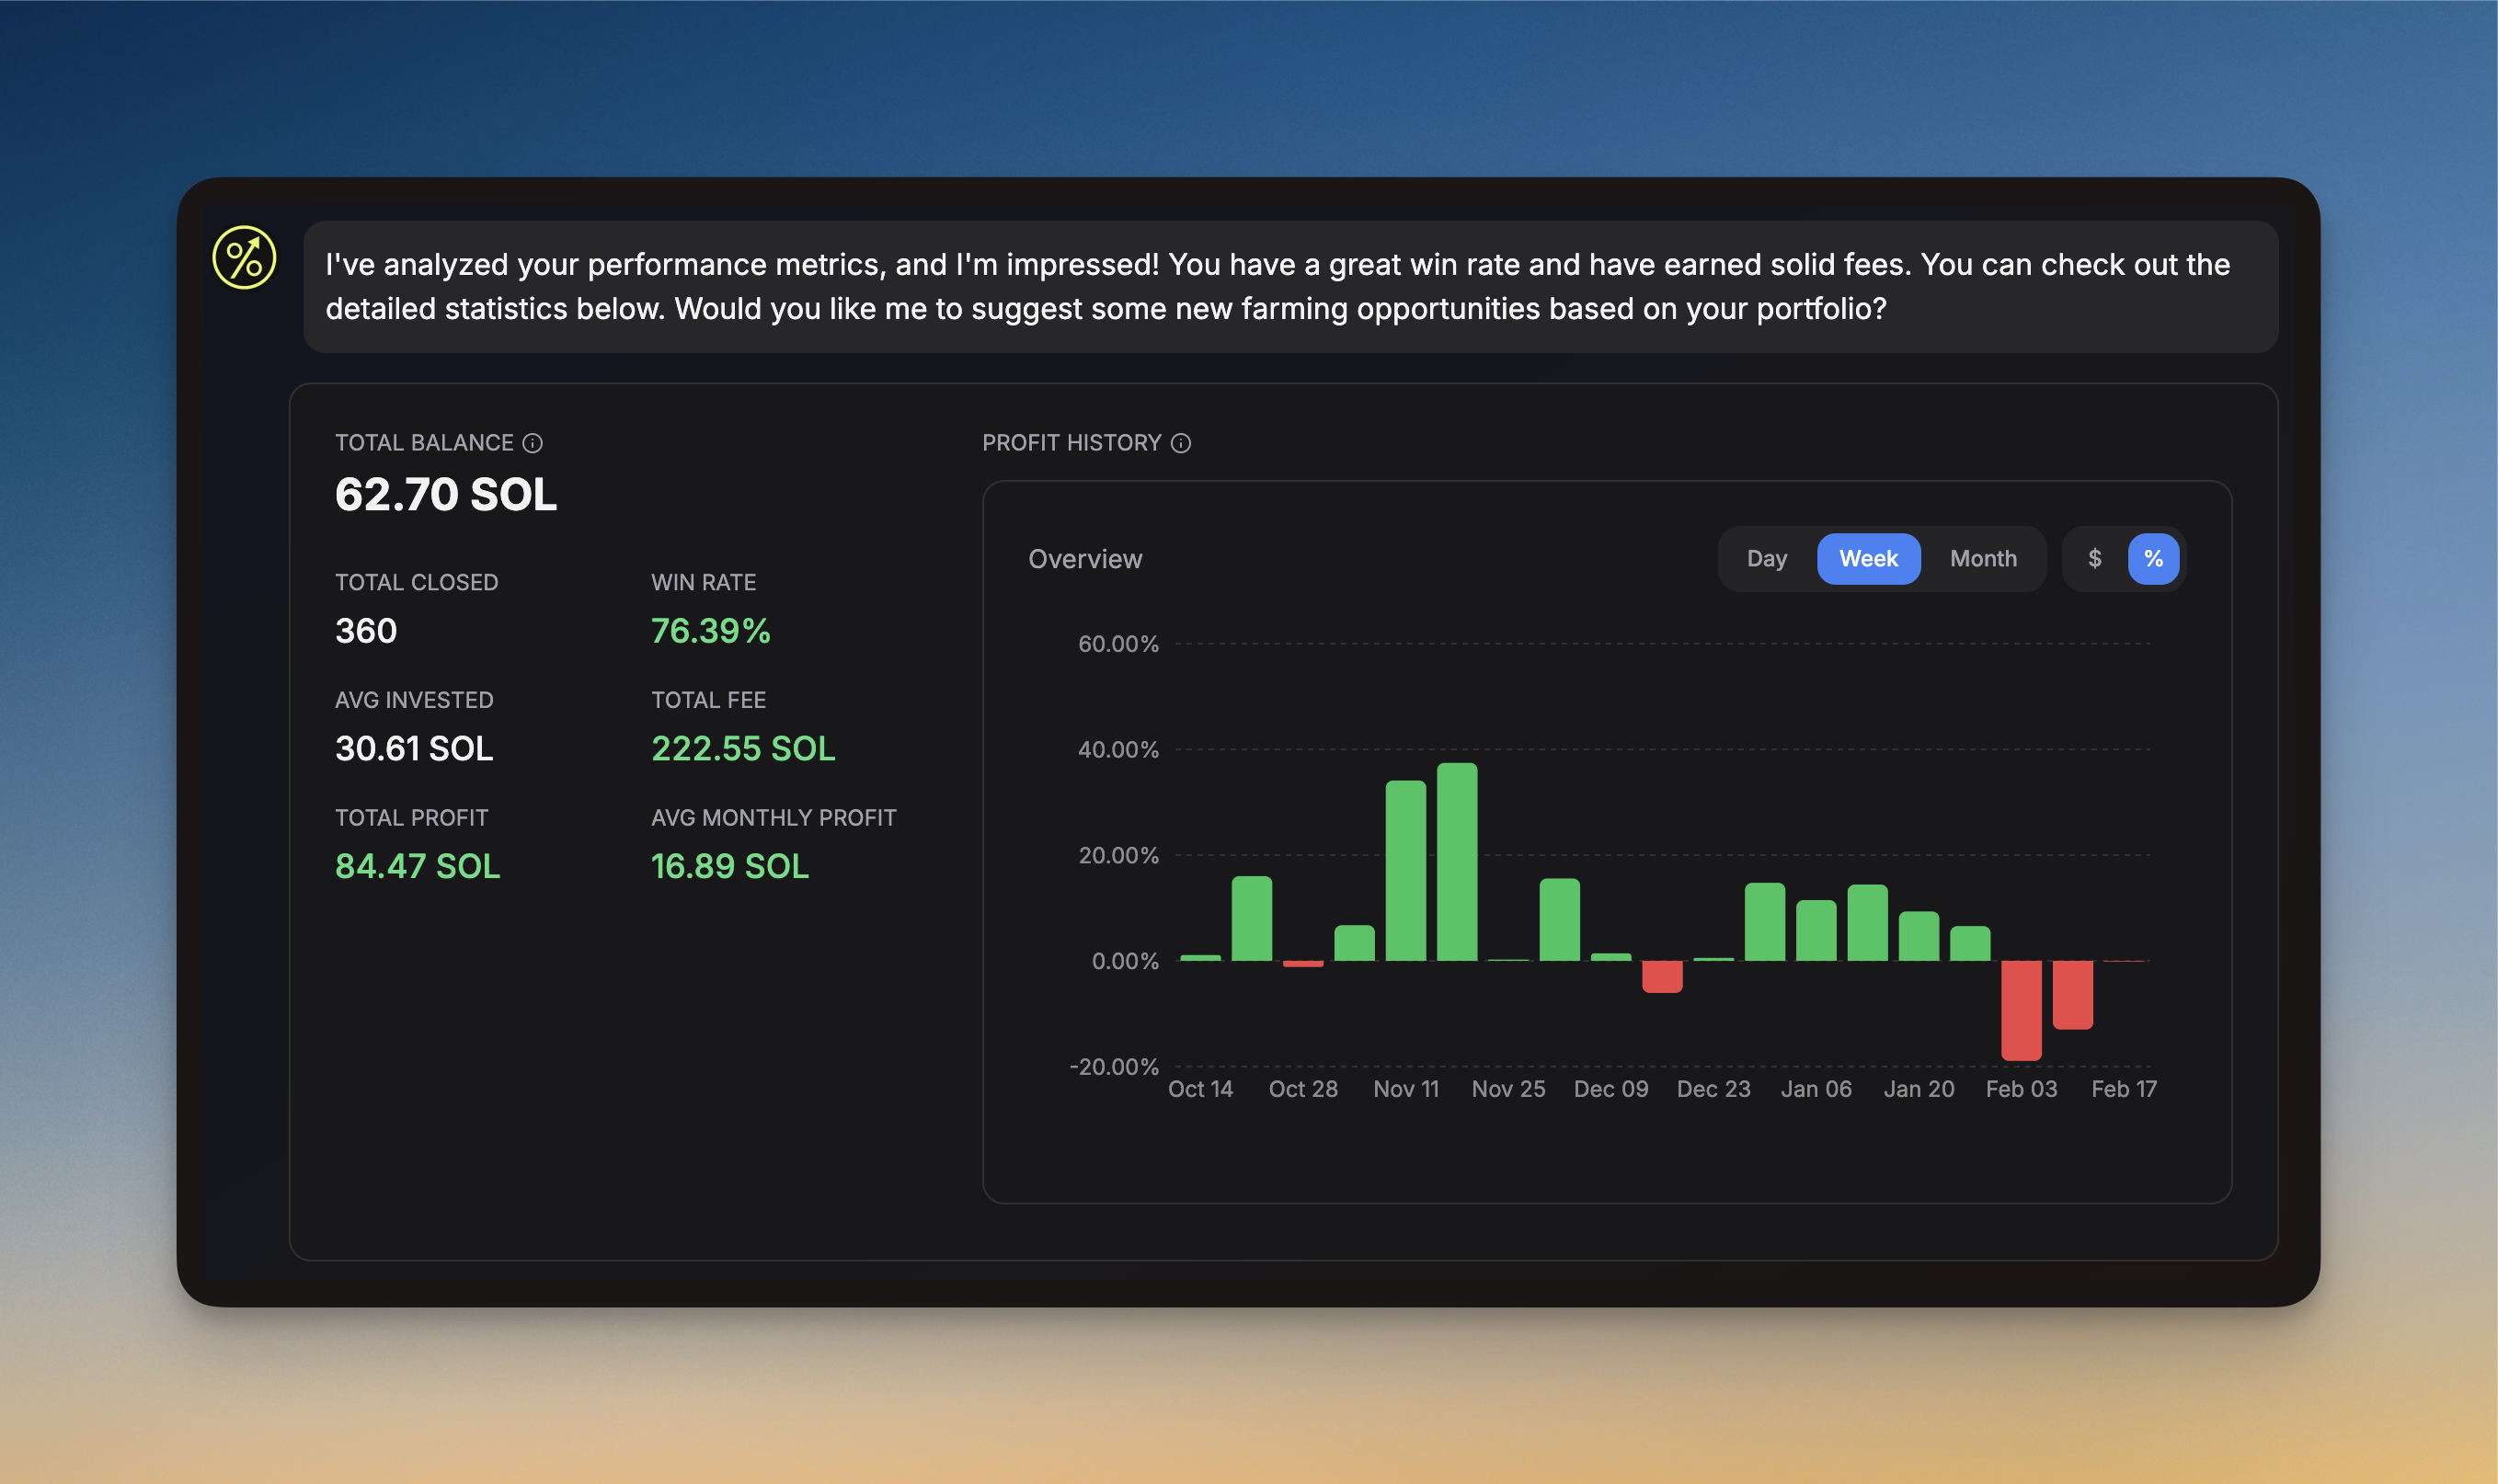
Interactive Charts
Profit History
Our advanced charting system shows:- Daily/Weekly/Monthly views
- Profit/Loss visualization
- Cumulative performance tracking
- Interactive data points
Key Features
- Time Period Selection: Switch between Day, Week, and Month views
- Value Display: Toggle between $ and % representations
- Interactive Tooltips: Hover for detailed metrics
- Trend Analysis: Visual profit/loss patterns
Smart Suggestions
Performance Analysis
AI-driven analysis of your trading patterns
Opportunity Finder
Personalized suggestions for new positions
Risk Assessment
Real-time risk evaluation and alerts
Strategy Optimization
Continuous strategy improvement suggestions
Quick Actions
- View detailed statistics
- Adjust active positions
- Deploy new strategies
- Access historical data
Explore Opportunities
Ready to explore AI-suggested farming opportunities? Click here to see
personalized recommendations based on your successful trading history.