PnL Calculation Insights
Understanding how Profit and Loss (PnL) is calculated is crucial for accurately assessing the performance of your liquidity positions. This document outlines our current methodology and explains certain considerations.Current Calculation (T1 to T2)
The diagram below illustrates the lifecycle of a liquidity provision: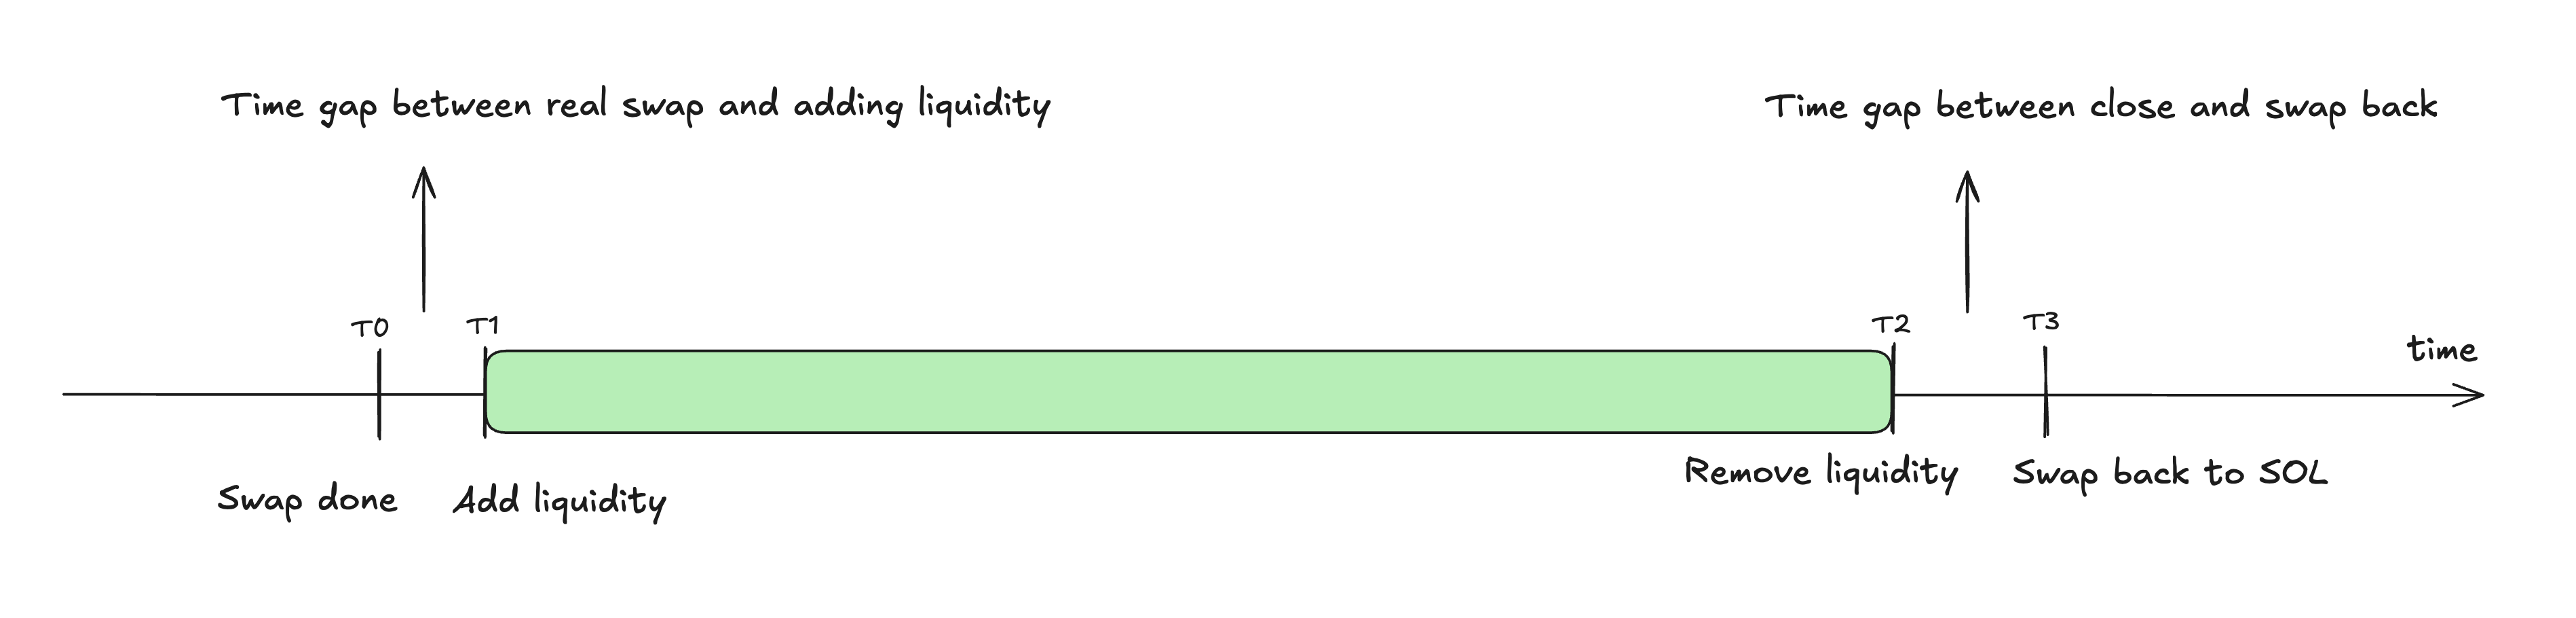
- T1: When liquidity is added to the pool.
- T2: When liquidity is removed from the pool.
The “Real World” PnL (T0 to T3)
In reality, a user’s overall PnL for a liquidity provision cycle might be more accurately reflected by considering:- T0: The price at which the user initially swapped their base asset (e.g., SOL) into the tokens required for the liquidity pool. This is the true entry cost.
- T3: The price at which the user swaps the tokens (received after removing liquidity) back into their original base asset (e.g., SOL). This is the true exit value.
Why We Use T1 and T2 for Calculation
While using T0 and T3 might seem more comprehensive, we cannot reliably use these points for standardized PnL calculation due to several factors:-
Uncertainty of User Actions:
- Post-Close Decisions: After removing liquidity at T2, we don’t know the user’s immediate intentions. They might choose to:
- Hold the received tokens.
- Swap them back to their original asset (like SOL) immediately.
- Swap only a portion of the tokens.
- Swap them for a different asset altogether.
- Pre-Open Actions: Similarly, the exact timing and execution of the swap at T0 can vary.
- Post-Close Decisions: After removing liquidity at T2, we don’t know the user’s immediate intentions. They might choose to:
- Attribution: Our system focuses on the performance of the liquidity provision itself. Price movements before liquidity is added (T0 to T1) or after it’s removed (T2 to T3) are influenced by broader market dynamics and individual user trading decisions, rather than the LP strategy’s direct performance.